MobbID Concepts
Biometric System
Biometric techniques enable the identification of individuals by analyzing one or more physical traits (such as face, voice, fingerprint, iris, or vein pattern) or behavioral characteristics (such as signature, gait, or interactions with mobile applications). Each of these factors —commonly referred to as characteristics— has unique properties and should be selected based on the security and functionality requirements of the system in which they are integrated.
A comprehensive biometric system must not only verify the identity of the individual presented to it but also ensure that the process is conducted legitimately. This means safeguarding against potential attacks aimed at compromising its functionality. The ISO/IEC 30107-1 standard outlines a biometric system architecture adopted by MobbID, ensuring maximum reliability and secure user identity verification.

Biometric System Architecture (ISO/IEC 30107)
Data Capture
The capture subsystem acquires biometric data, whether physical or behavioral, for identity verification. It processes modalities such as facial images and voice recordings, ensuring the relevant data is accurately extracted. Advanced algorithms identify key features, even under challenging conditions like poor lighting, low resolution, background noise, or partial occlusion.
Presentation Attack Detection (PAD)
According to ISO/IEC 30107, a presentation attack involves deliberately presenting a falsified biometric trait to the capture system in order to interfere with the biometric system’s function. In common use cases for Mobbeel's technology, presentation attacks may occur in the following scenarios:
- Photo/Mask Impersonation: Using a photo or mask to impersonate someone else.
- Image Replay: Using still or moving images to deceive the system.
- Synthetic Voice Generation: Creating a voice recording using synthetic methods to replicate the registered user’s voice.
- Voice Replay: Playing a recorded voice to impersonate the user.
Each of these elements is considered a Presentation Attack Instrument (PAI) and must be detected by the Presentation Attack Detection (PAD) system. Mobbeel's PAD uses only non-collaborative (passive) measures, eliminating the need for user interaction and reducing friction in the process.

Presentation Attack Detection According to ISO/IEC 30107
Biometric Modeling
Biometric modeling refers to the process of transforming biometric data—whether facial images or voice recordings—into numerical representations, commonly known as feature vectors. These vectors capture the most distinctive and discriminative traits of the biometric modality, enabling identity verification through comparisons between different vectors.
Historically, biometric modeling, including facial recognition, was performed manually. This involved selecting predefined descriptors and calculating key characteristic points, which were then compiled into a numerical representation. However, with the advent of deep learning, more robust and precise methods have emerged, capable of distinguishing subtle differences in biometric traits, such as identical twins or overcoming challenges like low image quality or changes over time.
For both facial and voice biometrics, modern techniques utilize deep neural networks, particularly Convolutional Neural Networks (CNNs) for facial modeling and Recurrent Neural Networks (RNNs) or other specialized architectures for voice recognition. These approaches, trained on extensive datasets, result in highly optimized descriptors that significantly enhance verification accuracy.
Mobbeel's technology integrates advanced biometric modeling capable of overcoming challenges like temporal variations, quality differences, and partial occlusions (e.g., masks for face or noise interference for voice).

Biometric Modeling Process
Quality Evaluation
Quality evaluation is a crucial step in ensuring the accuracy and reliability of biometric systems, whether for facial or voice recognition. High-quality biometric data is essential for effective identity verification, as it minimizes the risk of false matches and improves overall system performance.
For facial recognition, the captured image is analyzed to ensure compliance with the ISO/IEC 19794-5 standard, which defines requirements such as proper head posture, adequate lighting, and background uniformity to guarantee data suitability for biometric processing. For voice recognition, factors like clear audio, minimal background noise, and proper volume levels are assessed. Both modalities rely on specific quality metrics to ensure the clarity and precision of the captured data, making it suitable for further processing and comparison.

Quality Evaluation According to ISO/IEC 19794-5
Comparison
Once the feature vector has been obtained in the previous stage, various biometric operations can be performed to determine the user's identity. Each operation serves a specific purpose, and the choice of which to use depends on the application.
- Verification: Am I who I say I am? Given an input sample (either facial image or voice recording) and an identity label, the system verifies if the person is indeed who they claim to be by comparing the input with a previously stored reference. This operation requires a prior registration process.

Summary of Biometric Verification Process
- Identification: Who am I? Given an input sample, the system determines the user's identity by comparing it against a set of previously registered users.

Summary of Biometric Identification Process
- Matching: Are they the same person? Given two input samples, the goal is to assess their similarity. A common use case for this operation is remote client registration, where an image or voice sample from an identity document is compared to one taken from the user during the registration process.

Summary of Biometric Matching Process
Decision
The workflow of a biometric system concludes with the decision on the user's identity. In any of the three operations described earlier, the process is the same: the technology calculates the distance between feature vectors and returns a numerical value that represents the degree of similarity between them. This value forms the basis for the decision, but in most cases, the information needs to be expressed in binary terms: is it or is it not the same person? To achieve this, a decision threshold must be set, which determines the numerical value above which two samples (whether facial images or voice recordings) are considered to belong to the same person.
Choosing the most appropriate decision threshold is an important task, as it impacts the system’s performance. Too strict values may lead to rejecting a high number of legitimate users (usability or accessibility issues), while overly lenient thresholds may allow too many impostors to pass (security issues). The final choice should primarily consider the security requirements of the application where the biometric module is integrated. The integrator can choose a customized threshold to bias the system towards security or usability. Reference values can be found here.
Performance
Face Biometrics
To benchmark the performance of facial recognition technologies, the National Institute of Standards and Technology (NIST) launched the Face Recognition Technology Evaluation (FRTE) program in 2017. This program has become the de facto industry standard for evaluating facial recognition solutions. It assesses technology performance across diverse datasets simulating various real-world scenarios.
Verification 1:1
The following results correspond to Mobbeel's facial recognition technology evaluated in the FRTE 1:1 program as of October 2024.
Performance Metrics
The evaluation was conducted using MUGSHOT, a dataset containing frontal facial images compliant with ISO/IEC 19794-5 standards. The hardware environment included Intel® Xeon® CPU E5-2630 v4 @ 2.20GHz processors running Ubuntu 20.04.3.
| Memory consumption for feature vector generation | Feature vector size | Feature vector generation time (MUGSHOT) | Vector comparison time |
|---|---|---|---|
| 978 MB | 2048 bytes | 1098 ms | 5498 ns |
Classification Errors
The central element of the FRTE 1:1 evaluation is the calculation of errors made across different configurations (types of scenarios and databases). For each of them, NIST performs hundreds of thousands of verifications and stores the results returned by the biometric system. Once finished, it constructs the DET curve and selects the final result, which is the False Non-Match Rate (FNMR) at the point where the False Match Rate (FMR) reaches a predetermined value.
As an illustrative example, the CCN-STIC 140 Security Guide, used for the certification of Video Identification Tools, establishes that the biometric module must achieve an FNMR rate of less than 5% in the VISA-BORDER configuration. Mobbeel has achieved an FNMR of 0.45% in this category, making our technology 11 times more secure than the minimum required by the Spanish National Cryptologic Center for such applications.
| VISA-BORDER | MUGSHOT-MUGSHOT | VISA Yaw > 45º - BORDER | |
|---|---|---|---|
| FMR | 0.000001 | 0.00001 | 0.000001 |
| FNMR | 0.0045 | 0.0031 | 0.044 |
The chosen working point by FRTE 1:1 for referencing results corresponds to a very demanding threshold: it allows only one false positive for every million trials in the VISA-BORDER configuration (1e-06). If the system needs to be less strict, it is possible to adjust the decision threshold to lower values.
Below are the curves that show the relationship between decision threshold values and FMR and FNMR errors.
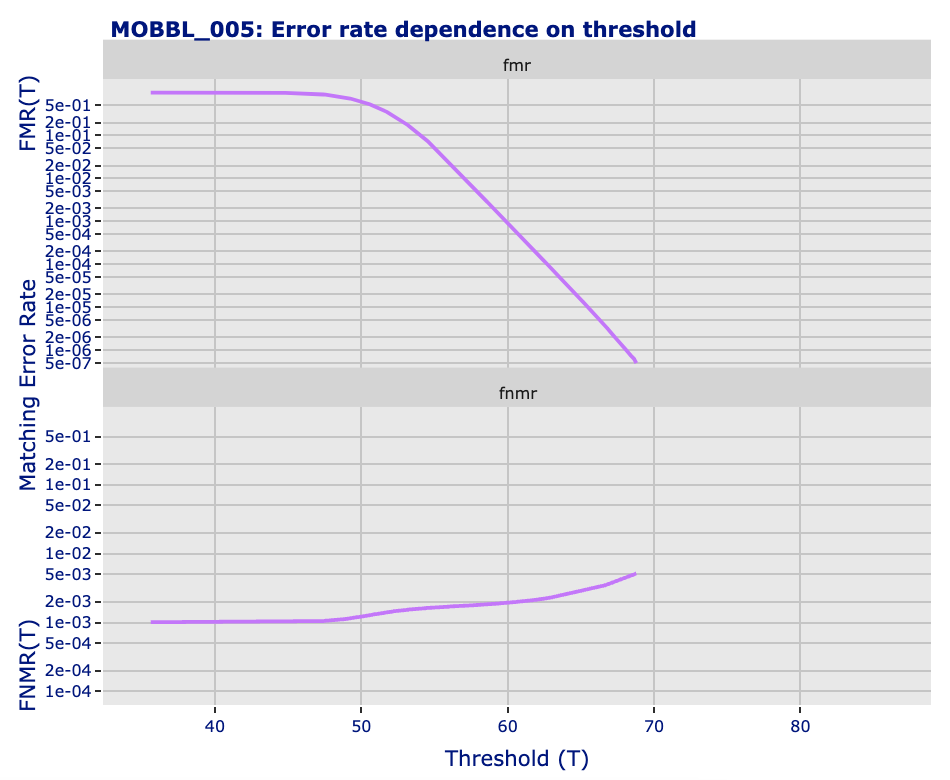
The table below provides integrators with three possible decision thresholds, which can be applied depending on the security requirements of the system.
| Decision Threshold | FMR | FNMR | Comment |
|---|---|---|---|
| 59 | 0.0018 | 0.0018 | Equal Error Rate (EER). Low security. |
| 63 | 0.000075 | 0.0023 | Medium security. |
| 68 | 0.000001 | 0.0045 | VISA-BORDER working point. High security. |
Demographic Bias
Machine learning-based technologies inherently exhibit biases to varying degrees, primarily due to the nature of the data used for training. In biometric systems, these biases are often demographic, resulting from the underrepresentation of certain age groups or racial categories. Such biases can lead to poorer system performance for these groups, potentially hindering their access to critical services.
At Mobbeel, we actively work to minimize the impact of bias in our algorithms by striving to represent demographic diversity as comprehensively as possible.
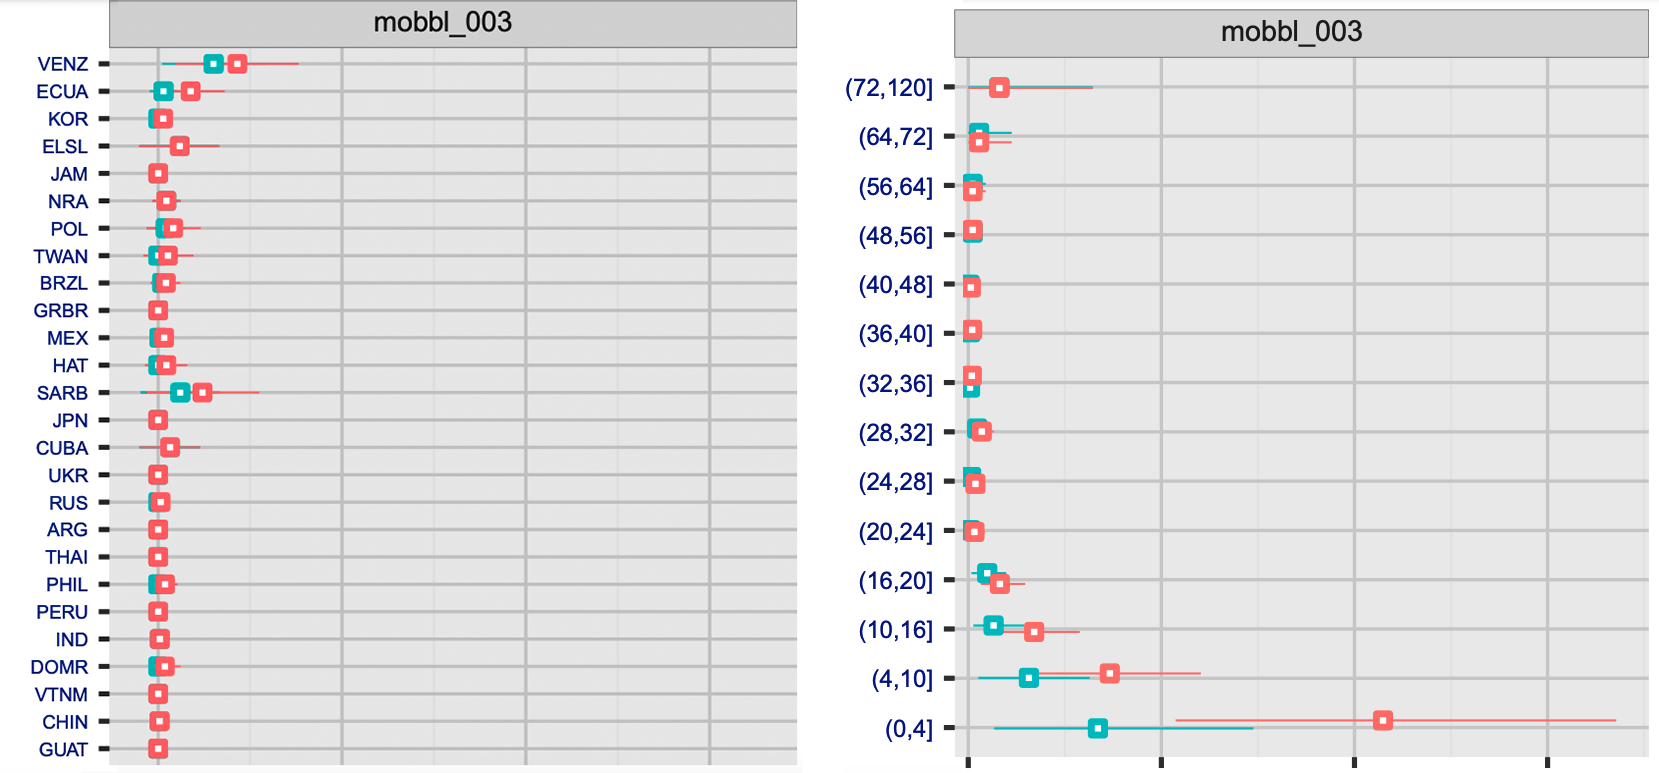
The FRTE 1:1 evaluation dedicates a thorough section to the analysis of demographic bias in facial biometric systems. The following figures illustrate how Mobbeel's results demonstrate a limited impact from this type of error:
- Left figure: The False Non-Match Rate (FNMR) is displayed for the VISA configuration across different countries of birth, using two operational False Match Rate (FMR) thresholds: 0.001 (blue) and 0.0001 (red).
- Right figure: The same results are shown, but this time considering different age groups. These results highlight Mobbeel's commitment to ensuring equitable performance across diverse demographics.
Identification 1:N
The following results correspond to Mobbeel's facial recognition technology evaluated in the FRTE 1:N program as of November 2023.
Performance Metrics
The evaluation was conducted using MUGSHOT, a dataset containing frontal facial images compliant with ISO/IEC 19794-5 standards. The hardware environment included Intel® Xeon® CPU E5-2630 v4 @ 2.20GHz processors running Ubuntu 20.04.3.
| Memory consumption for feature vector generation | Feature vector size | Feature vector generation time (MUGSHOT) | Vector comparison time |
|---|---|---|---|
| 978 MB | 2048 bytes | 1098 ms | 5498 ns |
Classification Errors
The evaluation within the FRTE 1:N program focuses on two types of scenarios:
- Identification: The goal is to determine whether the queried individual is present in the reference database.
- Investigation: The goal is to return a list of potential matching identities for further investigation.
In most cases, the primary goal of a biometric system is to identify an individual, for example, in an access control solution.
Below are the best results obtained by Mobbeel's algorithm in the identification configuration (the number of identities in the reference database is shown in parentheses):
| MUGSHOT-MUGSHOT (12M) | MUGSHOT-MUGSHOT (1.6M) | MUGSHOT-WEBCAM (1.6M) | VISA-BORDER (1.6M) | VISA-KIOSK (1.6M) | |
|---|---|---|---|---|---|
| FPIR | 0.003 | 0.003 | 0.003 | 0.003 | 0.003 |
| FNIR | 0.0250 | 0.0180 | 0.0589 | 0.0401 | 0.1823 |
As in the case of 1:1 verification, it is possible to choose less stringent operational thresholds (resulting in an increase in FPIR and a decrease in FNIR), although this is not recommended for most applications.
Presentation Attack Detection (PAD)
According to the ISO/IEC 30107 standard, an attack vector is associated with a Presentation Attack Instrument (PAI). The PAD system must be capable of detecting as many PAIs as possible while keeping the False Rejection Rate (BPCER) as low as possible. The number of potential attack instruments can be quite extensive, so in our case, we have limited it to those that are most likely to occur in Mobbeel’s common use cases: masks and paper prints, screen usage (both still image and video playback), and presentation of the identity document.
Performance Metrics
The PAD system processes a facial image provided during biometric verification. The performance metrics listed below were evaluated using m5.large instances on AWS (2vCPU, 8GiB RAM, Ubuntu 20.04.3).
| Image size (1280x720 pixels) | Response time |
|---|---|
| 800kB | 500ms |
Classification Errors
To establish a reference evaluation framework, the Celeb-A Spoof database was used, which includes images with various types of attack instruments. The results presented in the table should be considered as a reference, keeping in mind that performance in a real-world environment will be influenced by the quality of the captured images.
| APCER (paper print) | APCER (2D mask) | APCER (3D mask) | APCER (screen) | APCER (global) | BPCER | ACER |
|---|---|---|---|---|---|---|
| 0.009 | 0.010 | 0.019 | 0.007 | 0.019 | 0.009 | 0.014 |
Terms
- ACER (Average Classification Error Rate): The average error rate combining APCER and BPCER.
- APCER (Attack Presentation Classification Error Rate): The error rate of presentation attacks classified as legitimate attempts.
- AWS (Amazon Web Services): Cloud infrastructure used to ensure scalability and security for biometric systems.
- BPCER (Biometric Presentation Classification Error Rate): The error rate of legitimate attempts classified as presentation attacks.
- FMR (False Match Rate): The rate at which an incorrect identity is accepted.
- FNIR (False Negative Identification Rate): The rate at which a biometric system fails to identify a legitimate user. It represents the likelihood of a false rejection in 1:N identification systems.
- FNMR (False Negative Match Rate): The rate at which a correct identity is rejected.
- FPIR (False Positive Identification Rate): The rate at which a biometric system incorrectly identifies an impostor as a legitimate user. It reflects the likelihood of a false match in 1:N identification systems.
- PAD (Presentation Attack Detection): The system that detects presentation attacks, ensuring that the biometric sample is genuine.